


A Makerere University needs assessment of 106 frontline personnel across the PASSAGE project landscape, supported by International Development Research Centre (IDRC) /Foreign Commonwealth & Development Office (FCDO) and led by IGAD
By Anthony Egeru and Gordon Yofesi Mwesigwa – Department of Environmental Management, Makerere University
Drought does not arrive alone in the Greater Horn of Africa’s pastoral landscapes. It arrives with sick livestock, drying boreholes, and rangeland pushed past its limit — and a new Makerere University assessment of 106 frontline personnel across Karamoja, Turkana and Marsabit, Borana, South Sudan’s Equatorial States and Mandera now puts hard numbers behind what pastoralists have long known by instinct: the hazards are compounding, they are intensifying, and the communities most tied to livestock are absorbing the impact fastest. The data, gathered under the IDRC-Canada-funded, IGAD-led PASSAGE project, does more than document a crisis. It hands both PASSAGE and IGAD a specific, evidenced set of actions — and makes the cost of inaction explicit.
The hazard landscape: one dominant threat, three close behind
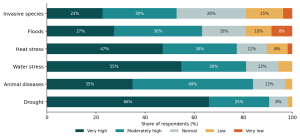
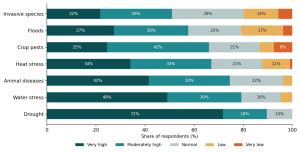
Asked to rate how common six major climate hazards are in their communities, respondents were nearly unanimous on the top threat: 90.6% rate drought as high or very high, with two-thirds calling it very high outright — the single strongest reading of any hazard on any question in the survey. But drought’s dominance obscures a more dangerous pattern underneath it. Animal disease (84.0% high), water stress (81.1%) and heat stress (77.4%) form a tightly bunched second tier, each affecting more than three in four communities. For a livelihood system built on livestock, this is not four separate problems — it is one compounding one. Drought empties water points and grazing land; weakened, concentrated herds become more vulnerable to disease; heat stress accelerates both. Floods (63.2%) and invasive species (52.8%) round out the list, still substantial but affecting a smaller share of the landscape.
| 90.6% rate drought as high or very high risk
The most dominant hazard signal anywhere in the survey — two in three respondents call it “very high.” |
The trend lines are moving the wrong way
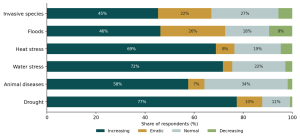
Prevalence alone would be concerning. The trend data is worse. Asked whether each hazard is increasing, erratic, stable or decreasing, 77.4% of respondents say drought is getting worse — the fastest-worsening hazard in the survey. Water stress (71.7% increasing) and heat stress (68.9%) are moving in the same direction, confirming that this is not a bad season but a deteriorating baseline. Floods stand apart for a different, equally important reason: only 46.2% describe a straightforward increasing trend, while a further 26% call flood patterns “erratic” — meaning any flood early-warning system tuned only to detect steady worsening will miss the unpredictable spikes that actually define this hazard on the ground.
| 77.4% say drought is increasing
More than any other hazard’s upward trend — a clear signal of a deteriorating baseline, not a bad year. |
Response effort is mostly following the danger
Encouragingly, current programming is not badly misallocated at the aggregate level: drought absorbs the largest share of response interventions for 89.6% of respondents, almost exactly matching its 90.6% prevalence score. Water stress (79.2%) and animal disease (74.5%) follow similarly matched patterns. Crop pests, measured only in this question, already draw a high response share from 66.0% of respondents. The one clear mismatch is invasive species: despite ranking last in prevalence, it still draws meaningful response effort from half of respondents (50.9%) — a signal worth investigating, since resources spent there may be resources not spent on the region’s fastest-growing threats.
Who is absorbing the impact?
The survey was not designed to isolate a single “most affected” demographic, but three converging signals point in the same direction. First, geography: nearly half of all respondents (48%) work in Uganda’s Karamoja sub-region, the landscape most represented in the sample and one of the hazard data’s most exposed geographies, followed by Turkana and Marsabit, Borana, South Sudan’s Equatorial States and Mandera-communities that, notably, often share the same herds and the same drought across borders that-maps do not respect. Second, livelihood exposure: because the hazards concentrated at the top of the list-drought, animal disease, water stress, heat stress-all bear down directly and simultaneously on livestock, it is livestock-dependent pastoralist households, rather than any single demographic group, who face the sharpest compounding risk. Third, access: elsewhere in this same survey, respondents flagged gender disparities in access to early warning information as a persistent barrier, and named elders and traditional knowledge holders-not formal institutions; as the most trusted source of climate information, suggesting that women and those outside traditional information networks remain the furthest from the warnings meant to protect them.
What communities already have, and what they don’t
Communities are not starting from zero. Traditional early warning signs such as animal behaviour and weather patterns are used by 85.8% of respondents’ communities, seasonal migration by 70.8%, and community meetings for information-sharing by 63.2%. Traditional knowledge systems (84.9%) and strong community networks (59.4%) are the two most widely reported existing capacities. This is a landscape rich in social capital and inherited adaptive knowledge.
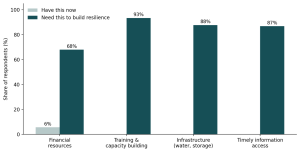
What it is not rich in is money. Only 5.7% of respondents say their community has financial resources to draw on for climate risk management — by far the weakest existing capacity measured. Set that beside what respondents say they need: 93.4% want training and capacity building, 87.7% want improved infrastructure such as water points and storage facilities, 86.8% want access to timely information, and 67.9% want access to financial support such as loans and grants. The gap between a 5.7% financial baseline and a 67.9% expressed need is, in effect, the resilience-financing gap PASSAGE and IGAD are being asked to close.
| 5.7% have financial resources vs. 67.9% who need them
The single widest gap in the entire dataset — and the clearest case for targeted financial-resilience investment. |
What this means for PASSAGE and IGAD
Taken altogether, the hazard and capacity data point to four concrete priorities rather than a general call for “more support.” First, treat drought, animal disease, water stress and heat stress as a single compounding risk complex in programme design, not four separate response lines — because that is how communities experience them, and current response allocation already implicitly recognises this by concentrating effort on exactly these four hazards.
Second, build flood early-warning tools around erratic, spike-prone behaviour rather than steady trend detection, given that floods are the one hazard where “erratic” outranks “increasing” as the dominant pattern.
Third, invest deliberately in financial-resilience instruments; livestock insurance, contingency grants, community-level emergency funds-since this is the capacity communities report having least of, and the support they say they need most, second only to training.
Fourth, route new investment through the channels communities already trust and use: traditional knowledge systems, elders, seasonal migration patterns and community meetings, rather than around them. IGAD and PASSAGE do not need to build trust in these mechanisms from scratch; they need to resource and connect them to the formal early-warning and financing systems the data shows are currently disconnected from where most people actually get their information.
None of this requires waiting for better data. The pattern is already clear, already quantified, and already pointing toward specific investments. What happens next — whether this baseline becomes the evidence for a resourced, coordinated resilience response or another well-documented warning that arrives too late to change the following season — is now a policy choice, not an information gap.